DX Dashboard
Sales, finance, acquisition and operational evidence in one working interface.
01The working overview
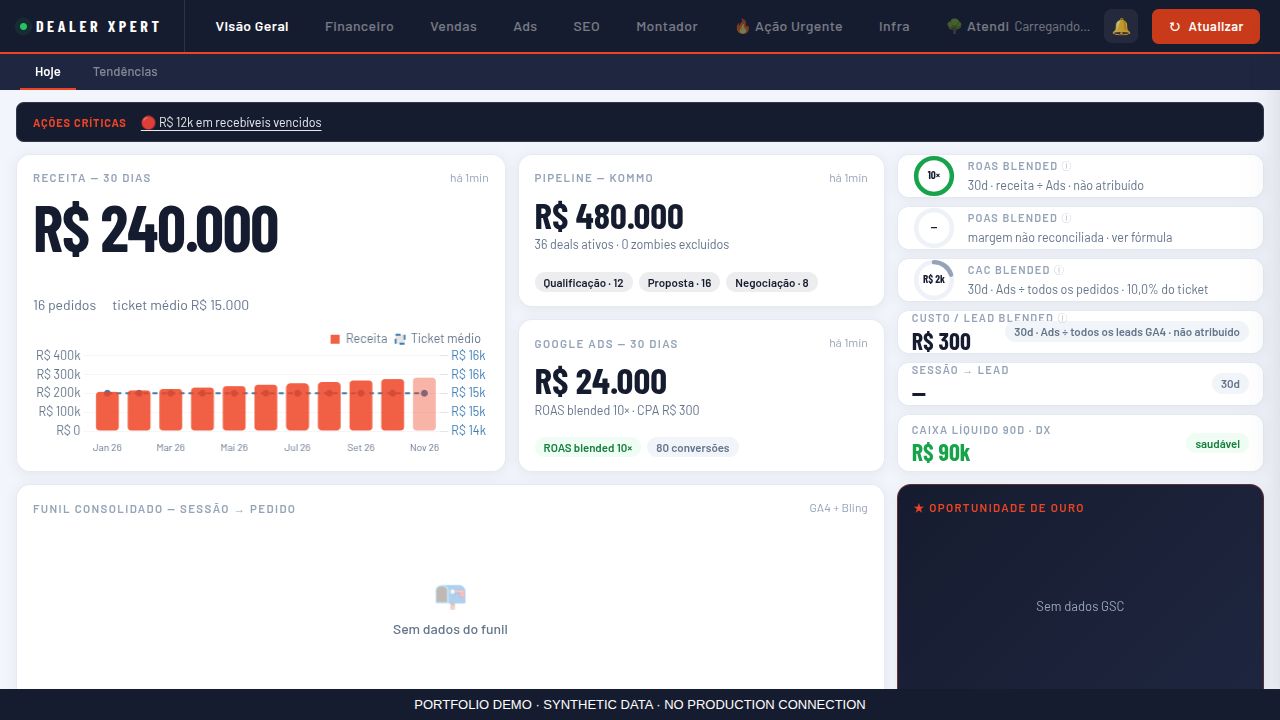
- Revenue, pipeline and acquisition share one view.
- KPI labels distinguish blended ratios.
- Source age stays beside the operational figures.
02
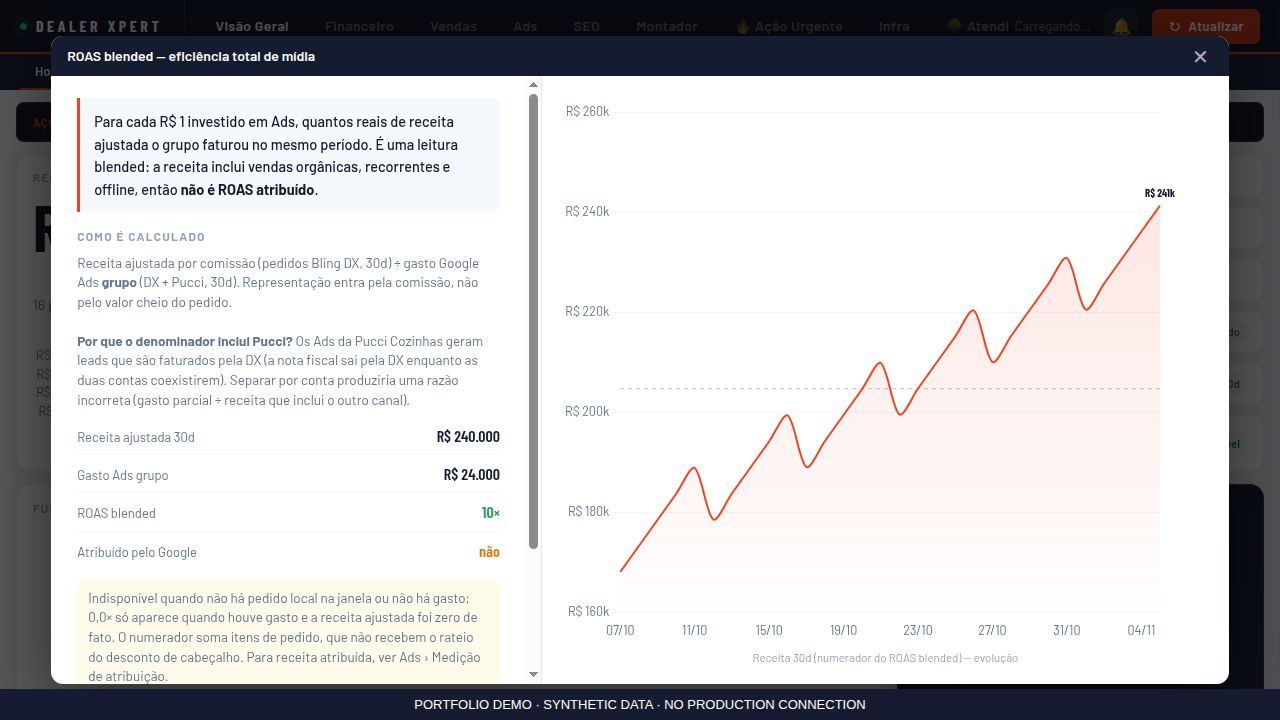
The metric details box
- The formula and its inputs explain the displayed ratio.
- A historical chart adds context to the current figure.
- The panel explicitly distinguishes blended and attributed results.
Behind the decisions
Connect operational sources
Collectors and stored snapshots bring together Kommo, Bling, Google Ads, GA4 and Search Console. The interface organizes the evidence into sales, financial and acquisition views.
Explain the number
Source age, metric definitions and availability matter as much as the value. Blended advertising ratios are identified separately from attributed results, and missing evidence must remain unavailable.
Move from reporting to action
Pipeline health, recent closings, forecast and urgent follow-up views help identify what needs attention. Detail drawers provide context without losing the current view.